Housemark
Housemark benchmarks the UK's housing associations so that the housing associations can compare their performances over a wide range of performance indicators.
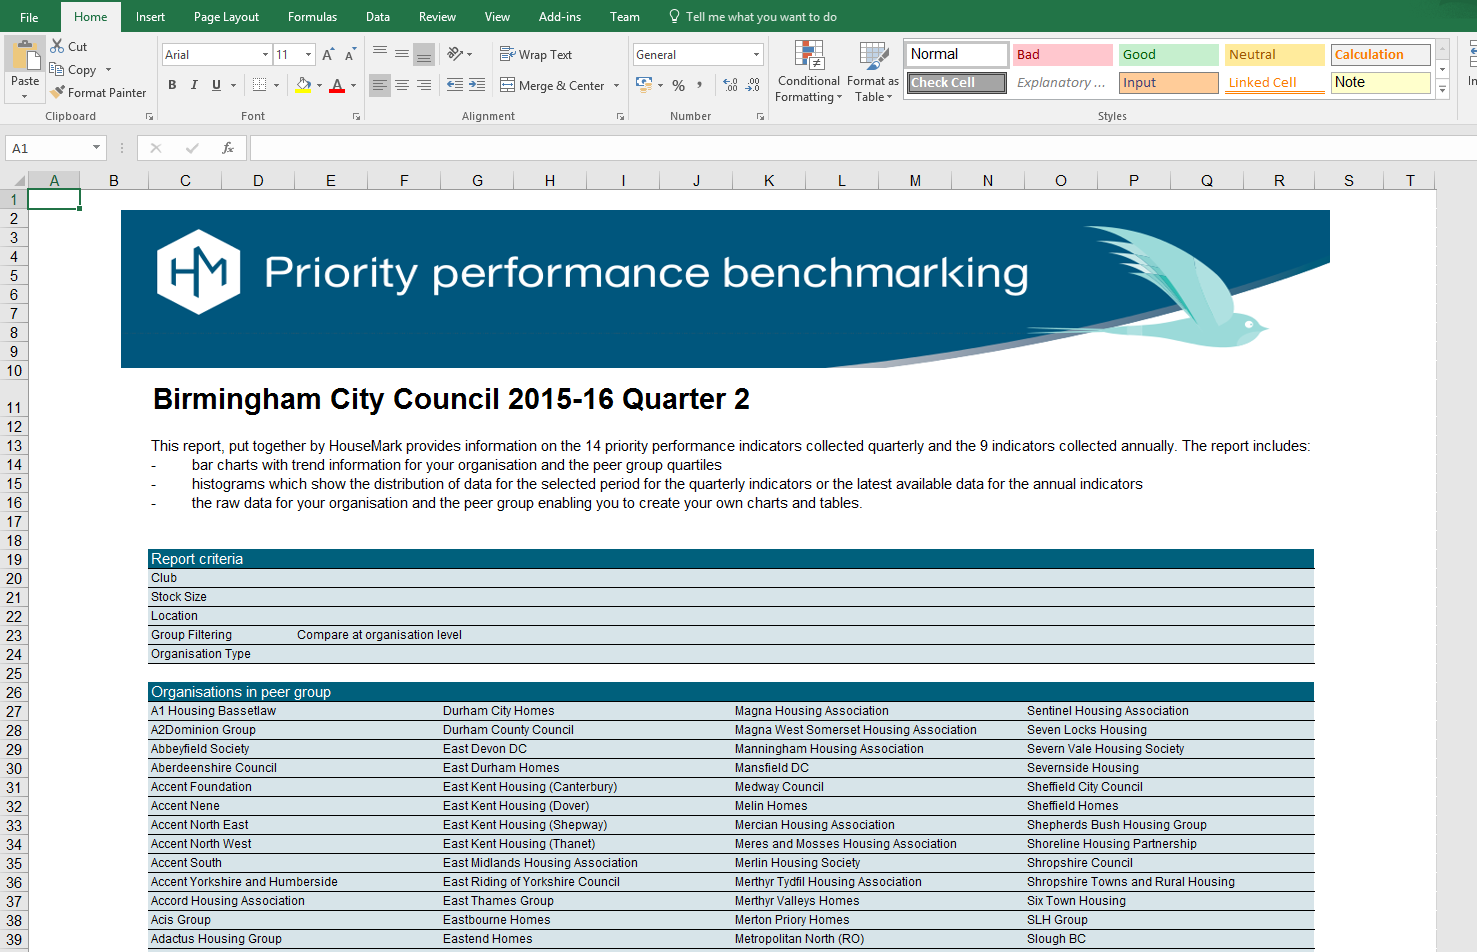
Web Project Example 1 benchmarking reports
My first example is the customers Priority Performance, ASB and Welfare Reform benchmarking reports pages.
This is an ASP.NET web page, with some JavaScript to open and close the bars to display the detailed charts and setup the filters.
The ASP.NET server gets the data from SQL Server and SSAS Cubes.
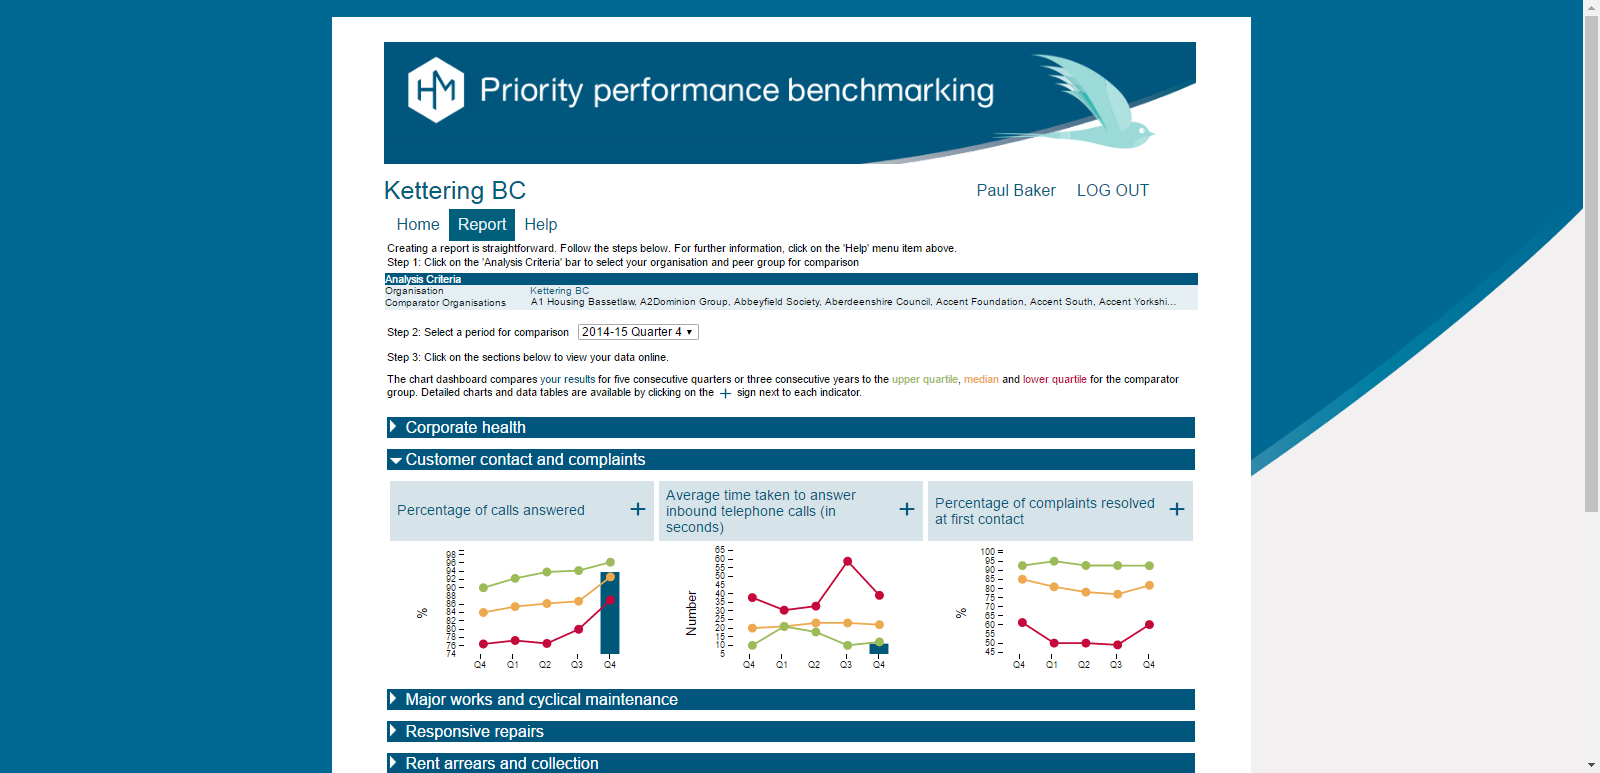 Here the customer can see their performance against other housing associations in the UK.
There is a login/Log out, a main menu with the current page highlighted and the blue bars at the bottom is where you can view the different reporting sections.
Here the customer can see their performance against other housing associations in the UK.
There is a login/Log out, a main menu with the current page highlighted and the blue bars at the bottom is where you can view the different reporting sections.
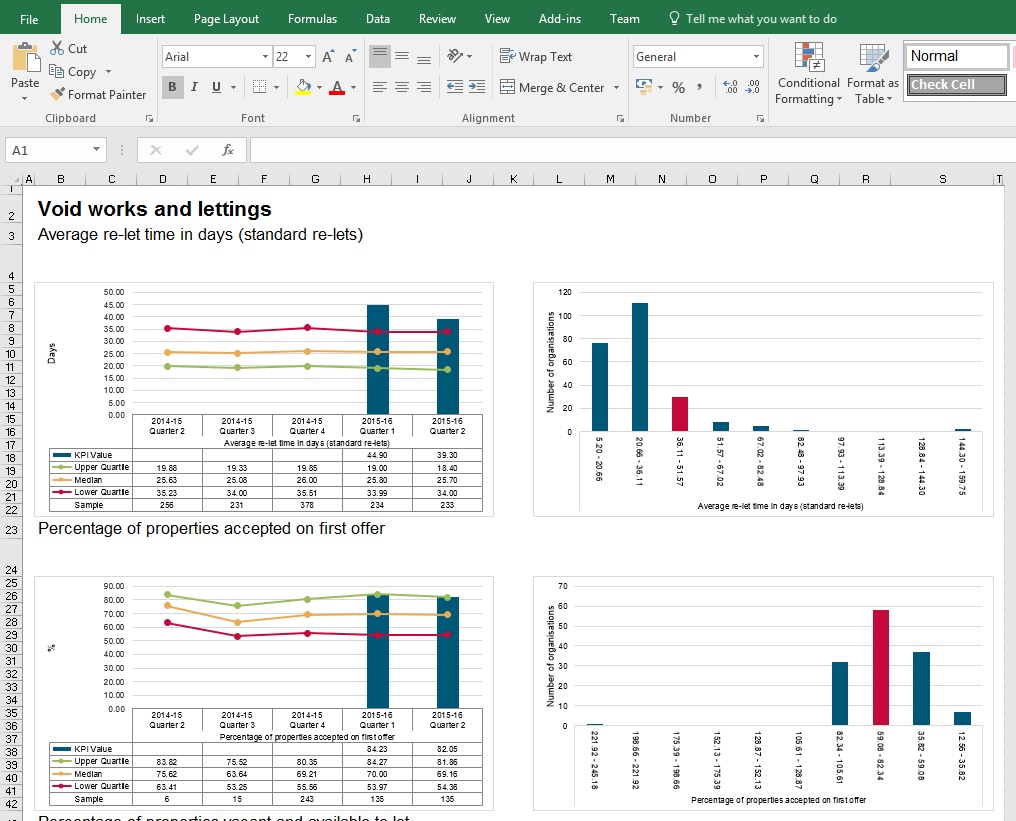
 By clicking on the blue bar you can see the report charts that are displayed using d3 data driven documents.
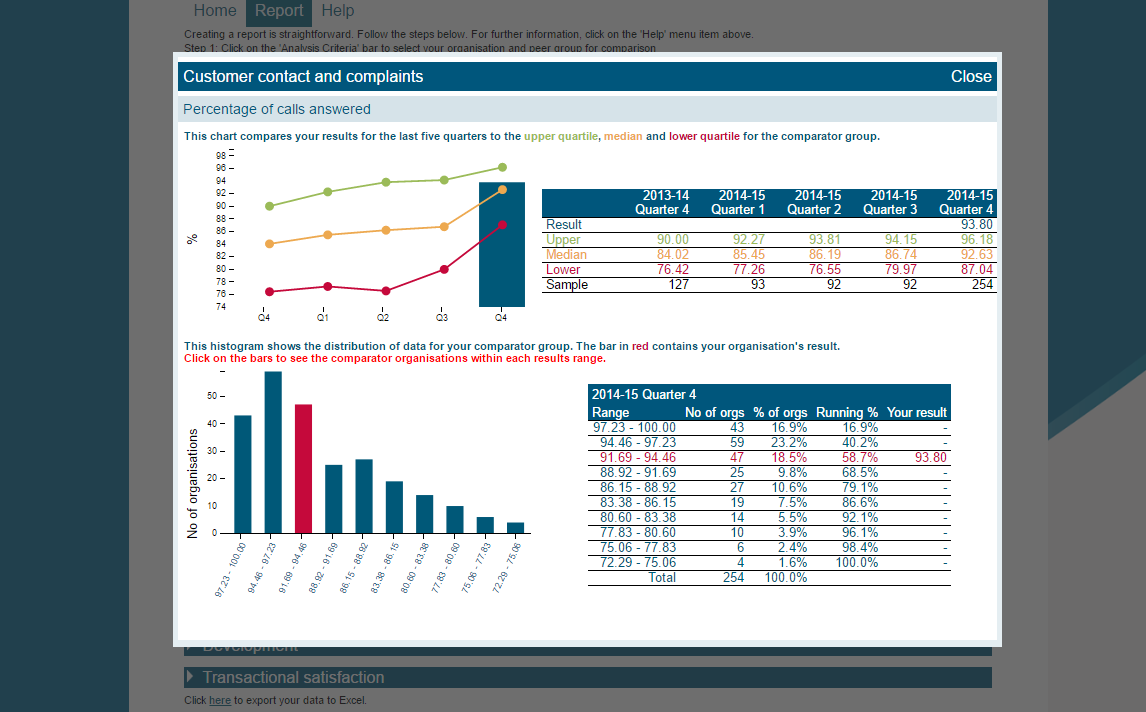
By clicking on one of the plus signs you can see the detailed charts as below.
By clicking on the blue bar you can see the report charts that are displayed using d3 data driven documents.
By clicking on one of the plus signs you can see the detailed charts as below.
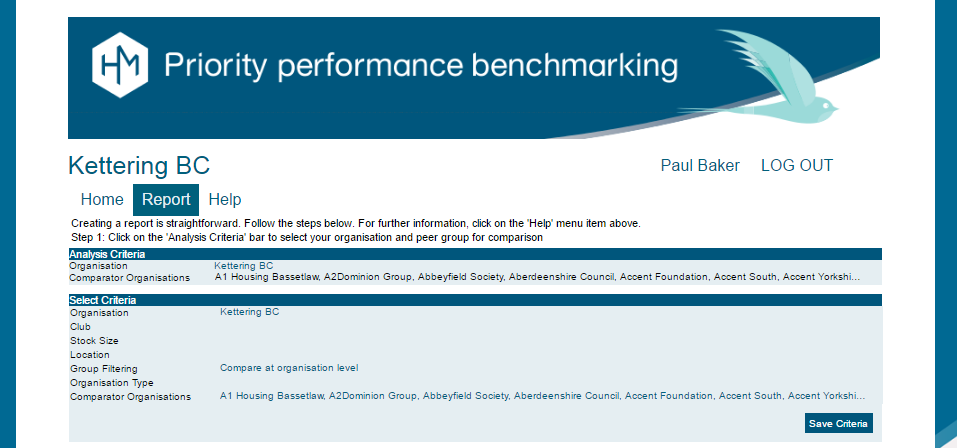 Above the bars is the criteria selection by clicking on this bar you can select your criteria as displayed bellow.
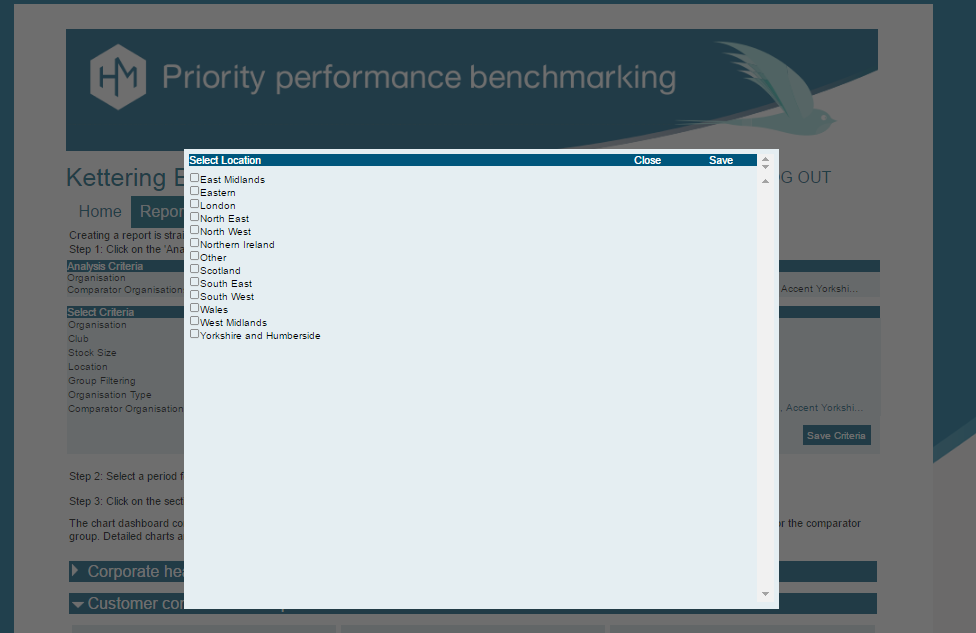 And the selection popup box.
 You can also download theses charts in Excel as pivot charts.
Web Project Example 2 Housemark Value for money scorecard.
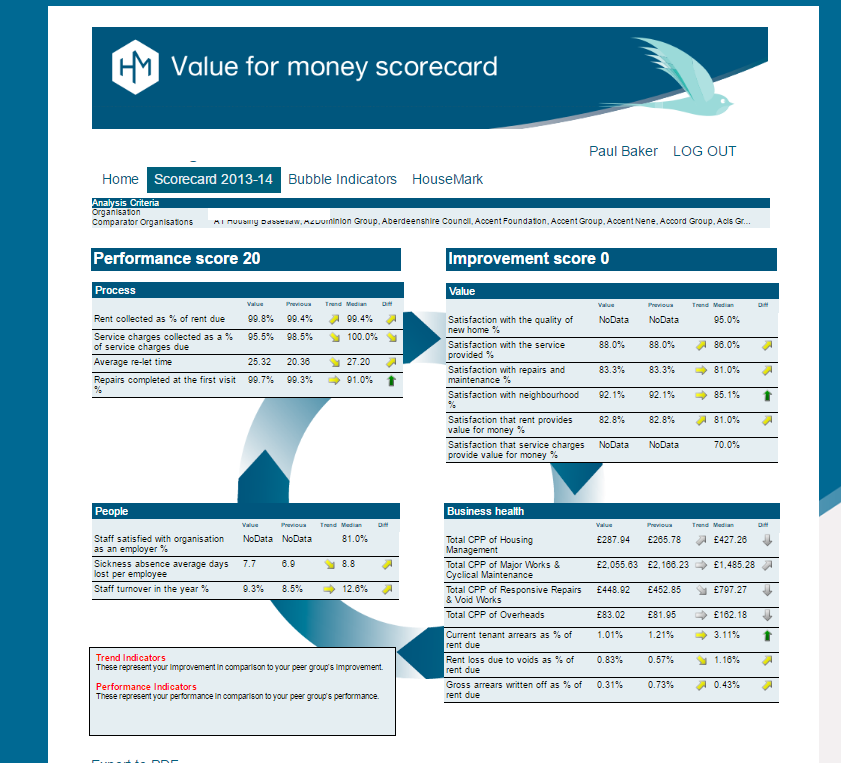 Here is a customer’s Value for money scorecard this is an SSRS report this can also be downloaded to excel,
the SSRS report gets its data from an SSAS Cube.
Here is a customer’s Value for money scorecard this is an SSRS report this can also be downloaded to excel,
the SSRS report gets its data from an SSAS Cube.
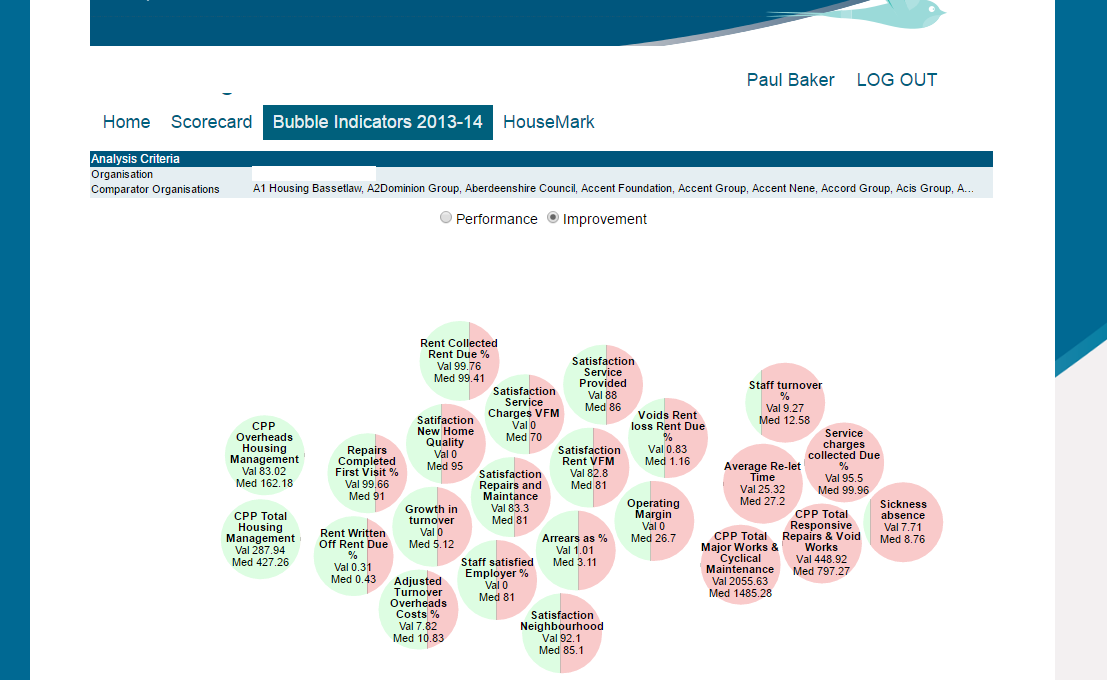 The scorecard has a d3 bubble page where they can see what performance indicators they are doing good and bad on.
By clicking and holding a “Bubble” you can drag it and it pushes the other bubbles around so it is highly interactive.
The scorecard has a d3 bubble page where they can see what performance indicators they are doing good and bad on.
By clicking and holding a “Bubble” you can drag it and it pushes the other bubbles around so it is highly interactive.
Web Project Example 3 Housemark Data Collection.
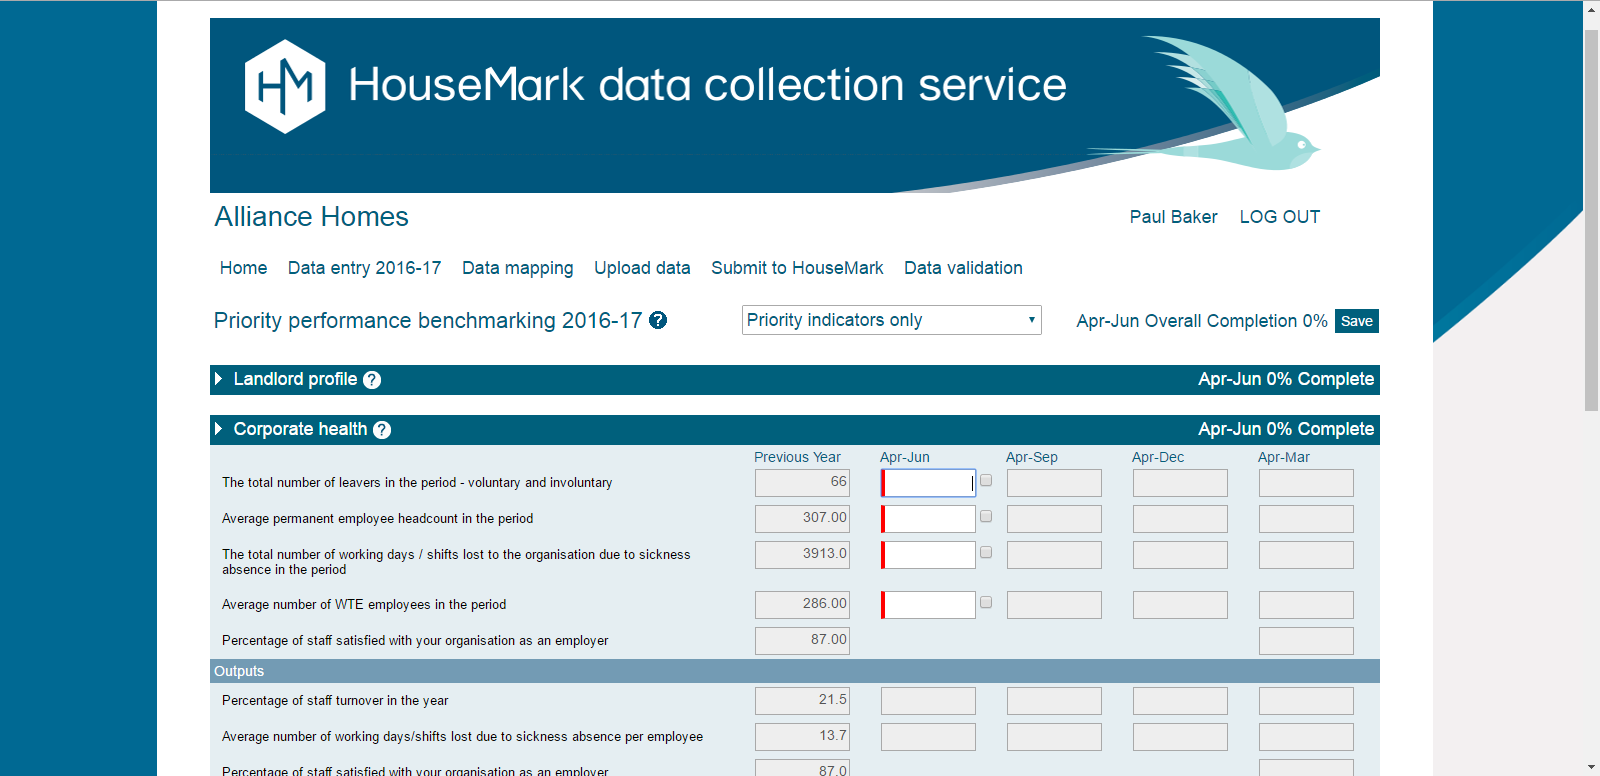 This project is a single page application using AngularJS and ASP.NET web services serving JSON,
this persists the data collection to a SQL Server database. Here they can input their benchmarking data.
They can save their data and when the submission is complete they can submit it and then the Housemark Data Services team can validate it.
This project is a single page application using AngularJS and ASP.NET web services serving JSON,
this persists the data collection to a SQL Server database. Here they can input their benchmarking data.
They can save their data and when the submission is complete they can submit it and then the Housemark Data Services team can validate it.
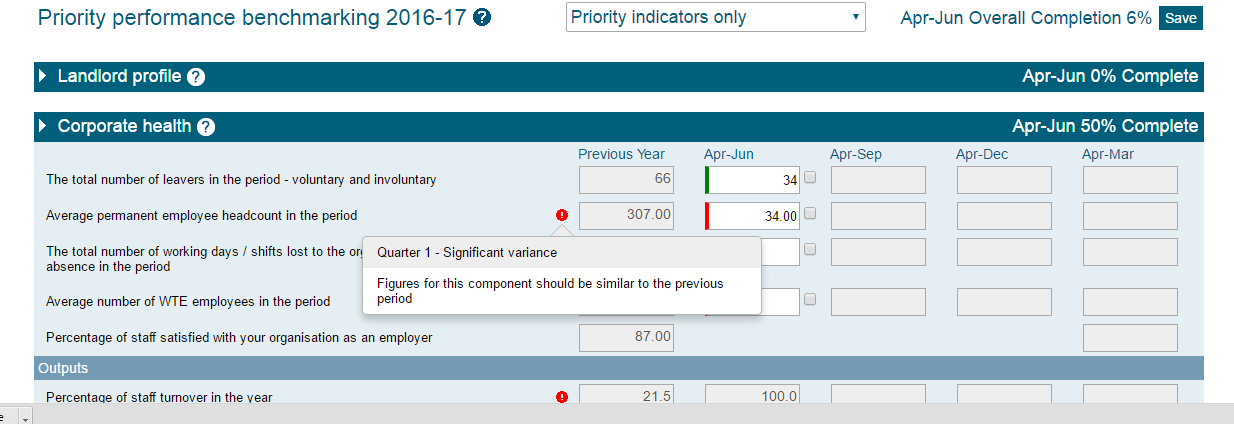 If there are no validation errors the submission gets auto validated and put into the reports.
If there is a validation error the user can see it with the red circle and when clicked,
you can view information on the error as below.
If there are no validation errors the submission gets auto validated and put into the reports.
If there is a validation error the user can see it with the red circle and when clicked,
you can view information on the error as below.
There are also many more pages with the data mapping and uploading data where the data collection can be automated.
I use a Luna JavaScript search engine for the mapping.